Kyushu is one of the 5 major regions of Japan consisting of 7 prefectures making up about 10% of the Japanese population. It is known as being a much more relaxed place than Tokyo, with great weather and more space. This attracts people who are looking for more worklife balance. Natives of Kyushu that go to the big city and return later, say to raise kids, do what is called a U-Turn. For non-natives that come here, they do what is called an I-Turn — just a straight line.
Due to its relatively lower land prices, a lot of manufacturing base has built up here over the years. Of course, Nagasaki was where Japan’s industrial revolution began in the late 1800s, and was the site where Mitsubishi really got started (at the Takashima Coal Mine). Nowadays there are many car manufacturers such as Nissan, Toyota, and Daihatsu, with factories in Kyushu. Steel production is important here and about 40% of Japan’s IC chip production is based in Kyushu. Other than manufacturing, Kyushu provides the rest of Japan with 20% of its food, and medical is another strong industry here.
To put Kyushu in context with the rest of the country, at least in economic terms, I compared Kyushu’s 7 prefectures with the top 7 prefectures in terms of GDP, which turned out to be convenient because those top 7 prefectures were the cut-off, accounting for half of Japan’s total GDP.

All this data is from the OECD and is in 2015-adjusted Yen. I am showing 2016 data here, but the trends tend to hold since 2000. Here is the breakdown in a table, showing the relative share of GDP for each of the prefectures compared:
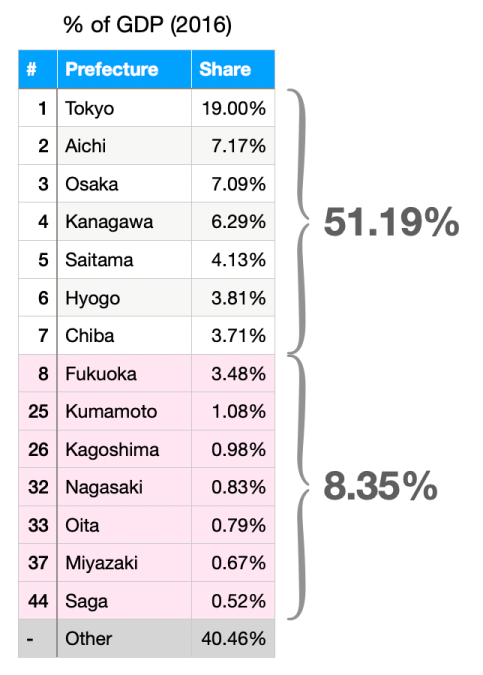
The top 7 prefectures make up 51.19% of Japanese GDP, and the Kyushu prefectures make up 8.35%.
Looking at population you can see, at least for Kyushu, size of population aligns with GDP rank. The Top 7 have 6X the GDP and 4.5X the population of the Kyushu 7
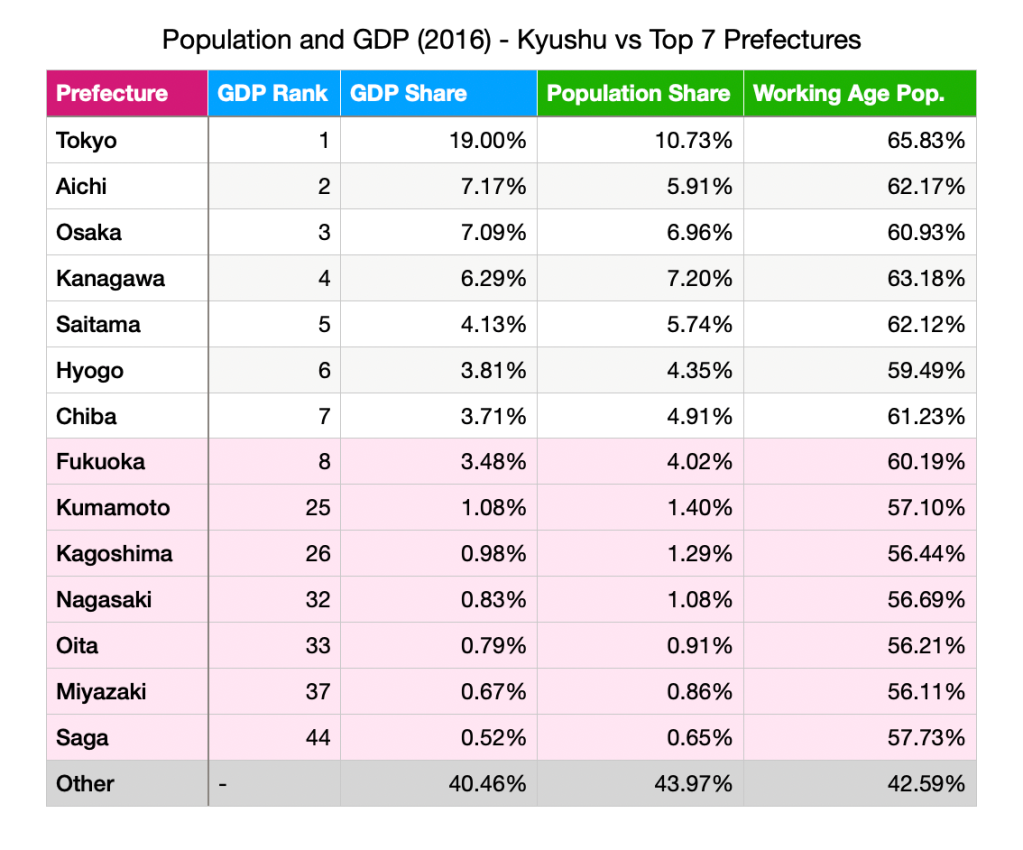
I added in the percentage of Working Age (15-64) population to see if the number of retired people in the countryside has an effect. For Japanese prefectures, the average percentage of the population of working age is 58.5%. You can see that for the top performing prefectures, their working age populations are higher than the national average. Tokyo is the top in the country at 65.83% (the lowest is Shimane at 54.49%). Of Kyushu prefectures, only Fukuoka is over the average. This demonstrates the pull of economic centres, and the migration of jobs to urban areas.
Fukuoka is far and away the economic hub of Kyushu. In the past 20 years it has always been in the top 10 as you can see from the chart below (lower is HIGHER rank). Miyazaki has moved up to 37 from a low of 42 in 2006, but other than that, things are pretty stable.
Not to say there isn’t growth, but it is mostly concentrated in Fukuoka Prefecture as you can see below.

Looking at the bottom 23 prefectures, the bottom half of the table where six of Kyushu’s prefectures fall, the average prefectural share of GDP is 0.71% and the median 0.69%. Only 2 of Kyushu’s prefectures don’t beat those numbers (Miyazaki and Saga). As you can see from below, Japan’s GDP is like a power law, with Tokyo providing almost a fifth on its own! Kyushu prefectures are spread out, with representation near the top, middle and bottom.

These are some simple stats to give you a sense of Kyushu within the context of Japan. I am still digging around, and will soon turn my attention to ExIm flows, which I am particularly curious about. Any little tidbits I find I will be sure to share!