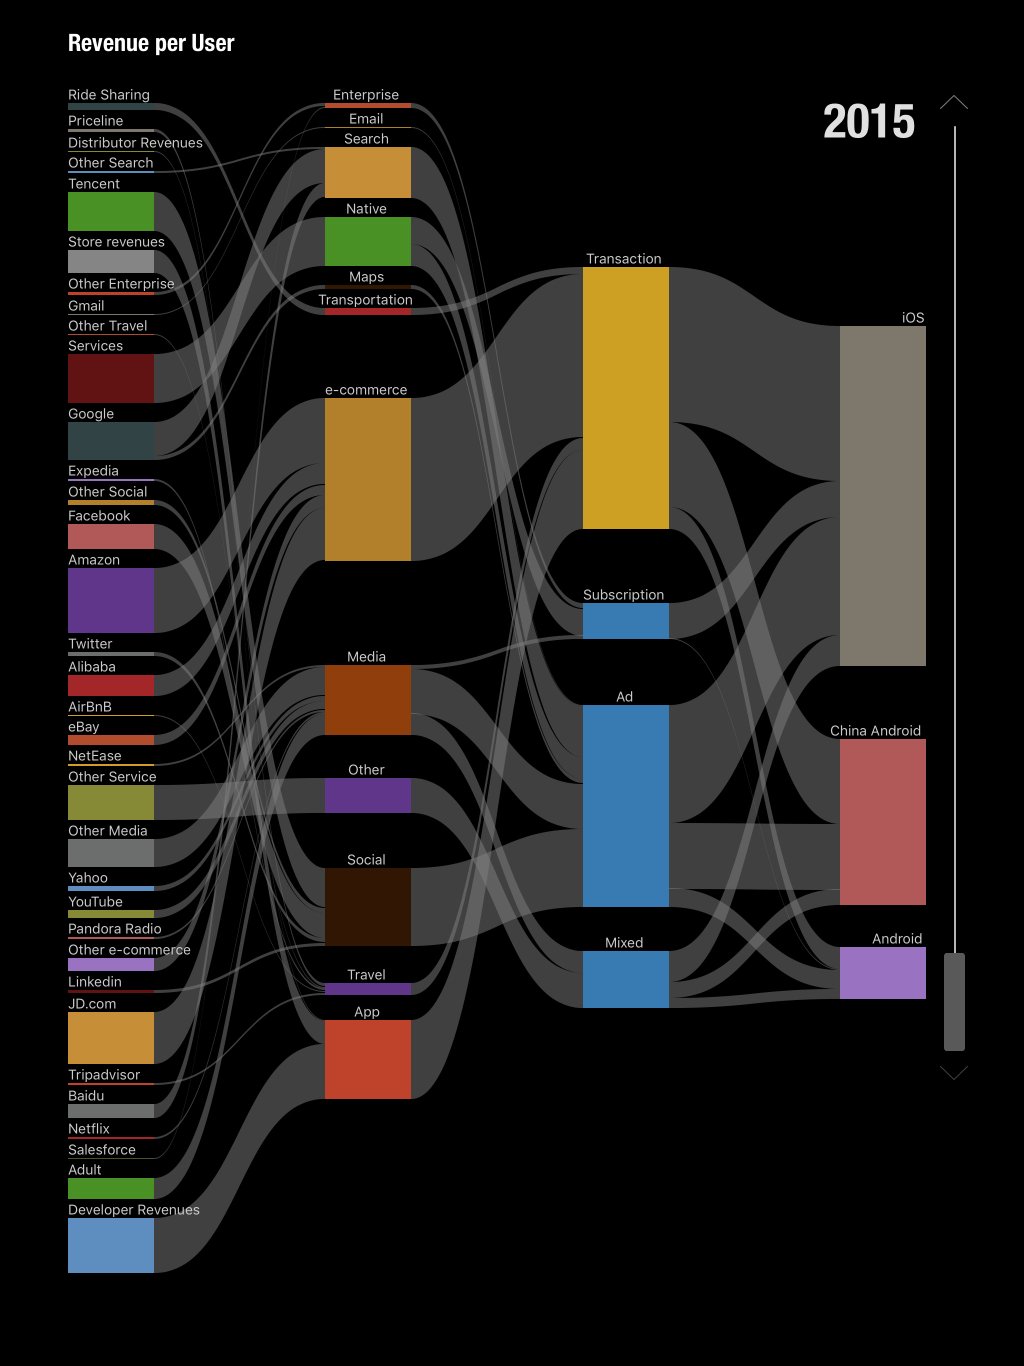
Consider the following chart showing how the Revenue per User flows for each of the major mobile platforms:
The chart belongs to a presentation where Horace Dediu looks at the future of online services. (Disclaimer: I have not been to the event, nor have I seen the presentation.)
At first glance, my first impression was: “Only four revenue models?” (Transaction, Subscription, Ad, or a mix of the three). On second glance: “Wow Advertising is pretty much the same size as Transaction.” But then later, in the shower, I started to ask: “What does ‘transaction’ mean anyways?”
Generally there are 7 revenue models:
- Production
- Markup
- Fee-for-service
- Commission
- Advertising
- Subscription
- Licensing
Horace has split out Advertising and Subscription in his chart, but Transaction seems to fold a few of those rev models inside of it. So I decided to attempt to reverse engineer the chart. Let’s take a look (click to embiggen):

Transaction is made up of four subcategories: Transportation, e-commerce, Travel and App. I reorganized each of the companies featured in the slide into their category, then labelled each with one of the five remaining revenue models (Production, Markup, Fee-for-service, Commission and Licensing). This is a complex endeavor since some of these companies do more than one thing. For example Amazon sells its own hardware, sells other people’s products, and licenses you Kindle and Audible books. Ridesharing companies charge you a fee-for-service and then take a commission from the driver (doesn’t sound like “sharing” to me, but that is another post).
Inside of the Transaction category the biggest group belonged to the Markup category. I have no way of separating out production and licensing revenues from those companies, but even simply adding them all up and comparing them you can see that Ads are bigger than any one Transaction subcategory.

Hey, ads are big (and growing), we know that already. But that fact may be hidden in Horace’s chart.
Why go through this exercise?
True, since I do not have access to the data set, and do not know what Horace’s intention is for this particular screencap, I could be speaking out of turn. That said, I find it very interesting to see how consumers are parted with their money, myself included. Think about what you spend your money on each day, and think about what you used to own, compared to what you merely rent or lease today. I don’t own much of anything anymore, not least my hundreds of Kindle and Audible books, iTunes tracks, or Google Play Movies and TV Shows. As a minimalist, I am okay with owning less, but I have issues with proprietary formats (I now use Downpour for audiobooks), and it seems especially egregious as they are pushed into the real world (ahem… John Deere).
For all the talk of innovation there has not been much on the business model side. We have had these 7 revenue models for a long time. Regardless of how dominant the Ads model is, it doesn’t work for everyone, and is in fact failing many of our vital institutions it once supported (ahem… public interest media). Unfortunately, most of the “innovation” around business models have been on the finance side, with very “innovative” accounting and debt models (ahem… subprime lending). The results have been runaway household debt and financial collapse. As with all things, technology helps out here too.
So, Innovators, we could use some new revenue models that are straightforward, and not detrimental to consumers.